The Future Of Retail: Metrics That Matter
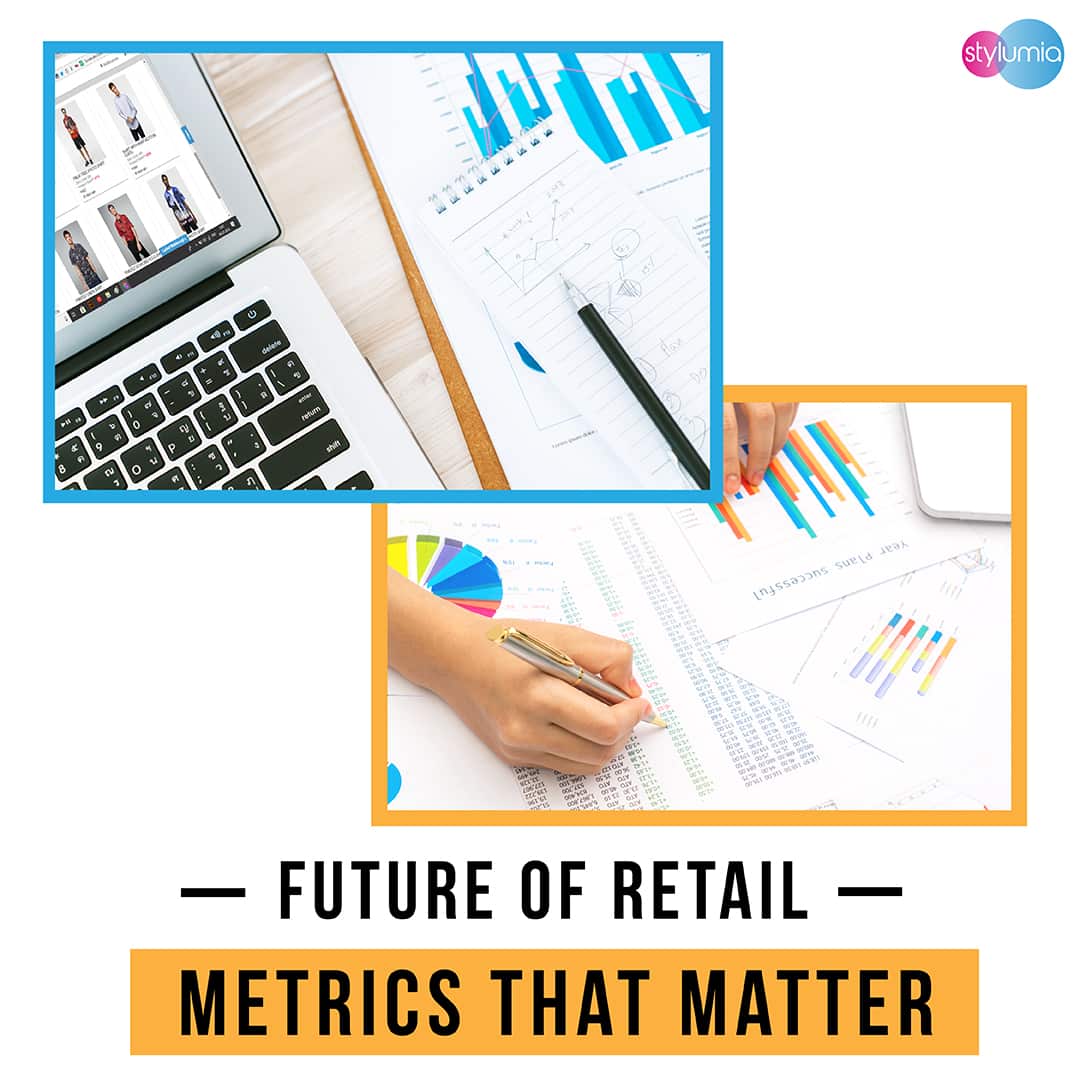

With the summer coming to an end and the fall preparation on, it will be good to take a look at the Retail landscape from a consumer perspective for the future of retail. It is also the right time to review your goals and start to measure what matters. As Peter Drucker said, ”What is measured improves”.
With the morphing of the retail landscape, what is important to you changes and hence what to measure.
With the connected consumers demanding “Control“, there is a need for Brands and Retailers to fundamentally shift their approaches to win consumers.
Here are some of the imminent key shifts:

The fundamental shift is from a pipeline of value delivery to a participative value delivery to consumers and their community. It is selling memories and not just products. Winners in the future will shift their approach significantly.


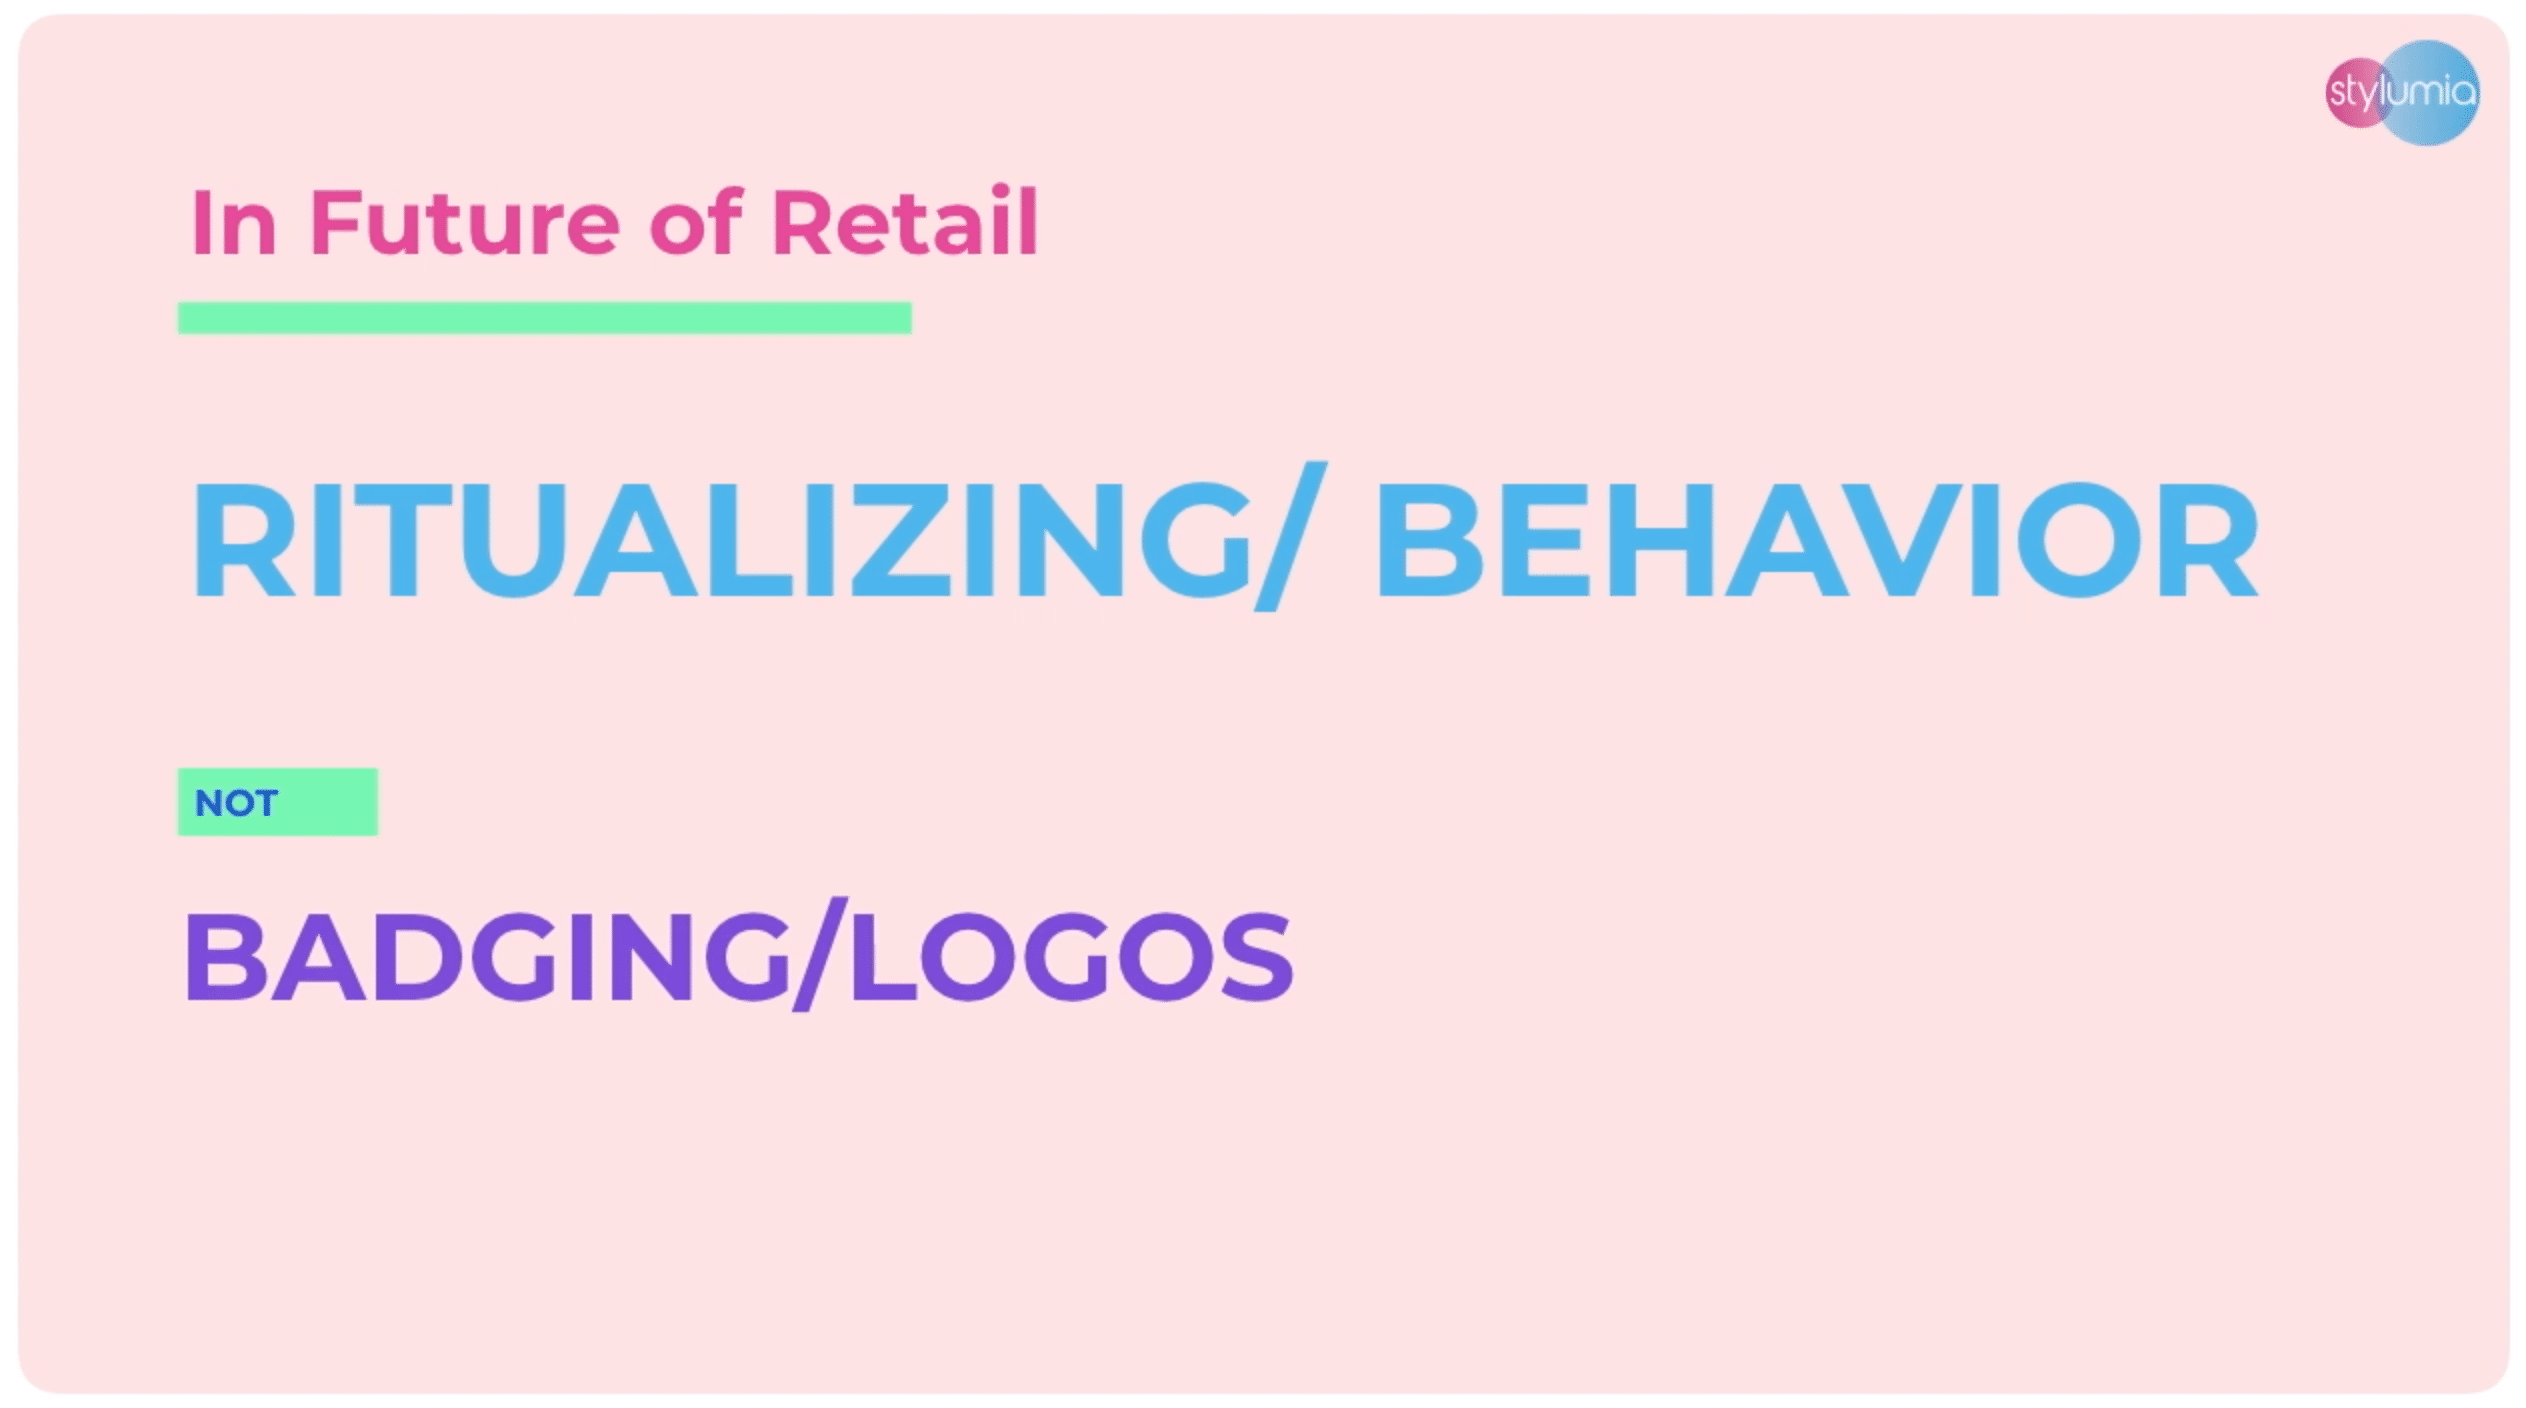
The future of retail is not “IN A BOX” anymore, and Brands will create “RITUAL-tailments”


There is a need to “Learn and Go”. If you wait for 100% certainty, you will be 100% late. Speed is key.

You can get the full view of the change in the Retail context in this video. With this new context, we wanted to compile and share a list of Retail Metrics which is a blend of traditional metrics and Future-Ready metrics. You can get the entire list of 22 metrics below.
Download Retail Metric PDF
We will dwell on one metric in this post. As fashion is full of forecasts, it is important to measure the accuracy of the forecasts and ensure that this metric improves over time. The inspiration for this comes from the world of machine learning. When machine learning models predict, there must be a method to choose the right model. The metric used to measure the accuracy of the prediction is the F1 Score.
Fashion forecasts are done by style using a numeric (1-5) or an alphabetical scoring (A to C) to indicate how good the potential of the style is. To simplify this, let the styles be categorised as Winners, Mediocres and Losers (pre-season) by each forecaster.
Once the actual results come in, plot the actual vs. prediction in the template below:

After plotting the prediction vs actual occurrences of a forecaster, the F1 score can be computed as follows
F1 Score = 2 * (Precision * Recall)
—————————
(Precision + Recall)
We need to compute Precision and Recall
Precision = True Positive
—————————
(True Positive + False Positive)
Recall = True Positive
—————————
(True Positive + False Negative)
To get clarity on TP, FP, TN & FN, we will take a Cricket analogy.
True Positive: Umpire gives a batsman NOT OUT when he is NOT OUT
True Negative: Umpire gives a batsman OUT when he is OUT
False Positive: Umpire gives a batsman NOT OUT when he is OUT
False Negative: Umpire gives a batsman OUT when he is NOT OUT
If the F1 score is calculated every season and forecaster, the brand will have a clear idea of the strengths of forecasting in the organisation.
This is where the power of technology comes in to enable every decision-maker with the predictive powers of machines.
Stylumia’s tools come with the potential to enable informed decision making by all stakeholders. You need tools that provide relevant metrics in a form to take quick actions pre-season, in-season and post-season. Hope you found the metrics and shifts useful. In case you have a metric that is critical for the future of retail that we have missed, or any comments on the metrics please share here.

