Localized Assortment Or Lose: A Live Store Concept
With inherent risks in the fashion business, considering lead times and constant change in demand patterns, it is not enough to forecast the trends better (design and make the right products), order the right quantities (predict the demand of unseen products) but also send them to the right stores in right quantities and at the right time. In the case of online channels, it is showing the right products to the relevant consumers at the right time.
In this edit, we will look at current practices in distribution, need for a new way to look at designing and executing relevant assortments to stores.
# Why Localization?
Stores are the final or the last mile in meeting the demand. While most of the supply processes are an aggregation of expert judgments, traditional consumer research, trade partner inputs (consumer demand-driven decisions are taking over the traditional processes here too), it is very important to meet the store demand with the relevant products. A store is an aggregation of consumers, their dynamic demand needs and market conditions. All the efforts spent in the upstream (design to delivery) processes will lose their value if this last mile is not taken care of properly. For example, improper distribution can have the following business impact.

The relevance of product quantity and quantity impact the performance. The challenge is, the quality and quantity are not binary as simplified in the figure above – they are gradients in real life.
# Status Quo
To illustrate how styles and stores interact from a demand perspective, we took a small sample of 20 styles and 10 stores and organized them on their demand potential metric (Rate of sale when sizes and stock were available). The distribution of demand is as follows,

As you can see, stores treat styles differently at least 7-8 ways and styles have different affinity at least 5 ways in this small cross-section of distribution. A dimension of time is also missing here as time can impact the seasonality of the demand in those stores and also have an impact on the style relevance.
You may be managing distribution by
1. Fixed standard segments of stores and styles
2. Clustering techniques
While (1) is seriously limiting in terms of the heuristic as no one store treats all styles in the same way and the other way around. This will be an approximation that will put you into an over-stock and under-stock situation. Even if you want to correct, it would involve a lot of inter-store stock transfers costing both time and money.
Traditional Clustering techniques (2) take into account attributes of stores and products, and they help you take the efficiency to the extent that you are not grossly making mistakes at the level of attributes.
In fashion, textual attributes do not help us communicate the product in detail.

Attribute like color as an example can not be described in the text. The traditional clustering techniques using text can hence recommend a poor performing ‘red’ to a store. With visual dimensions in fashion being many, there is a need for a new way to localize assortment.
# New Way to Localize Assortment
The new way must be able to
a) Understand the taste of a store like a human eye dynamically
b) Study what is on offer and come out with affinity for styles available
c) Prioritise the allocation
This is possible by using ensemble machine learning models that can study the product images, attributes and store performance data.
This needs a lot more data discipline including product images and functional attributes in the form of text.
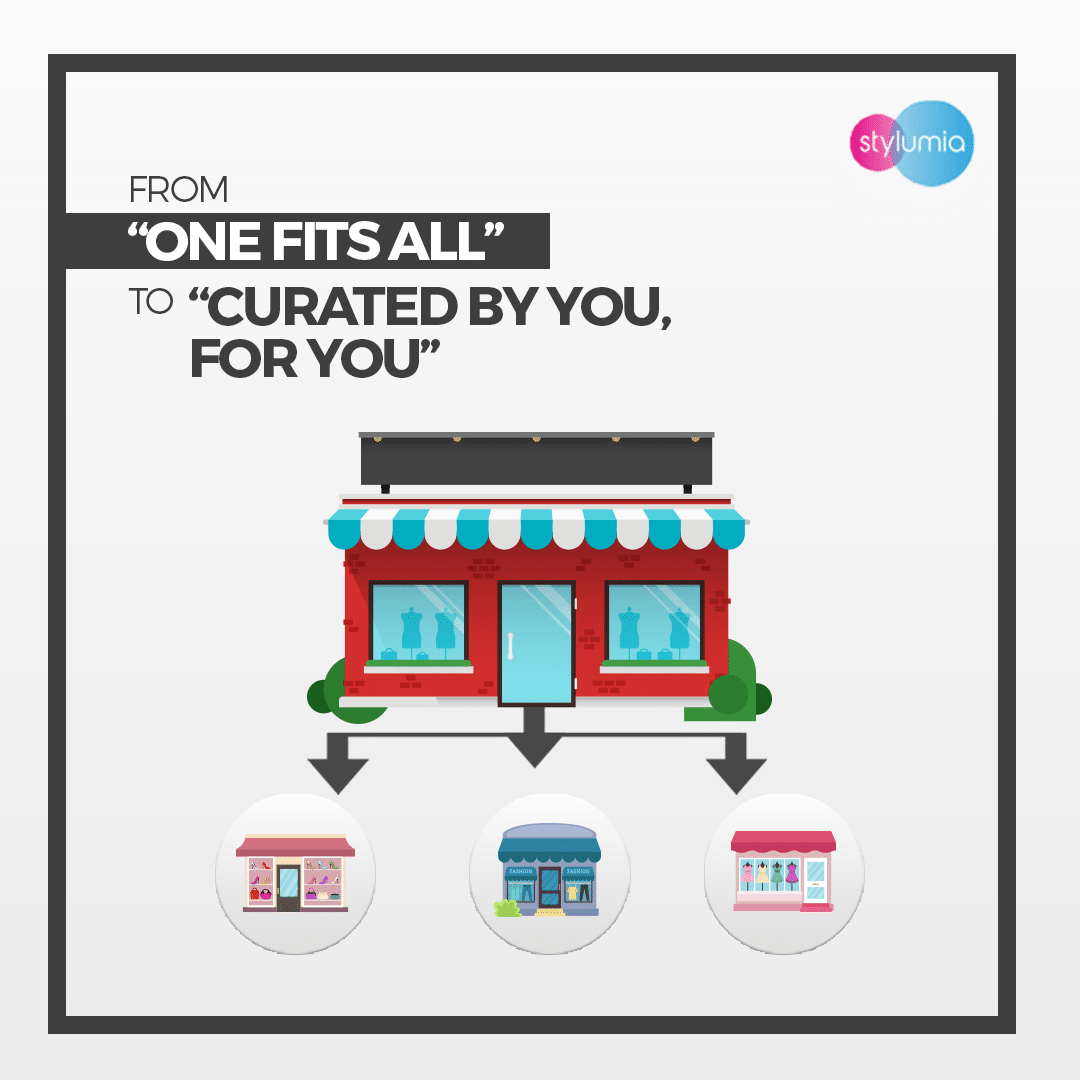
We are calling this concept of Localization moving from a ‘STANDARDISED” process to a “LIVE STORE”. In this method, the store is alive and providing signals in various forms for the allocation system to dynamically adjust the supply on the moving taste of the store and availability of styles.
Stylumia has a proven track record of using a proprietary methodology in predicting the demand for unseen products pre-season and demonstrated forecast accuracy improvements in the order of 10-40%. Being driven by a unique vision + text AI model, this is a higher-order performance than existing forecasting systems. In case you are an omnichannel retailer, the model can take into account both the store transaction details and also geo-specific details for the relevant stores from the online channel.
You can augment the product localization with experience at the point of sale. Product and experience curation are key levers of offline survival. If you would like to move from Standardised to LIVE STORE movement and maximize the potential for your brand, please reach out to us.