A Fundamental Flaw In Inventory Optimization For Fashion
Inventory optimization for fashion is a top priority for leaders now. The inventory if not managed well, can break any fashion business.
In this edit, we look at a fundamental metric for assessing the performance of products. The inconsistencies in measuring True Demand and how it impacts all inventory optimization actions.
“human beings have a strong dramatic instinct toward binary thinking, a basic urge to divide things into two distinct groups, with nothing but an empty gap in between. We love to dichotomise. Good versus bad. Heroes versus villains. My country versus the rest. Dividing the world into two distinct sides is simple and intuitive, and also dramatic because it implies conflict, and we do it without thinking, all the time.”
― Hans Rosling, Factfulness: Ten Reasons We’re Wrong About the World – and Why Things Are Better Than You Think
Current Practice For Measuring Product Demand
We are at a critical juncture. Many fashion brands and retailers globally are facing challenges of managing their full price sell-throughs, reducing inventory pile up, and managing markdowns. Apart from the business metrics of revenue and profits, as an industry, we are responsible for minimising the carbon footprint in the world by doing more with less.
In other words, understanding True Demand is key to learn and improve. Continuous improvements call for learning from the past apart from using technology to predict the future. When you ask the question “Can you show me your top sellers?” to anyone in the industry, which metric do you think they would use for coming up with the leader board?
1. Net Sales Value
2. Net Sales Quantity
3. Rate of Sale/week Value
4. Rate of sale/week quantity
5. First “n” weeks rate of sales
Which one of them do you use to measure demand? You can share your metric here. This is crucial in inventory optimization for the fashion business.
In our view, as shared in our previous edit “How to move your business with Metrics?” a good metric is one that is comparable, understandable, and relative. Hence the rate of sale is the right metric to understand how products perform. It connotes the velocity of demand. While knowing that is important, and many do, what is critical is how the metric is computed makes a lot of difference.
After studying various patterns of sales, here are our observations on how what we see can be misleading.
Computing Sales Velocity
The rate of sale is the demand per unit time at the point of sale. For example, it is the rate of sale per product per store per week. If that is the case, how would you calculate the overall rate of sale of a product at the country level? You would calculate the rate of sale of each product at the store level and sum it up across the country level. Is it not simple?
Is this accurate enough? There is a catch here. The real demand for a product is reflected in sales when the product is in-stock. How does this impact the calculation?
Going back to the method, in order to calculate the real rate of sale, you need to consider every product-store level sale on days when there was a stock of that product. This means you need to have sales and stock information at the product-store level on a daily basis. The product launch date in each store can be different. This means it is a calculation at each store independent of other stores.
The next level of precision is to do this at the SKU level.
What is the challenge here?
In our experience, most of the fashion brands and retailers do not preserve stock data at the store level for the past periods at a day level and the information is available at the week/month level. Even when it is available at these granularities, the sheer complexity of calculation makes it difficult for the systems to compute this metric on the run as the stock and sale information sit in discrete systems or the lack of awareness of the impact of how the metric is computed.
At this point, we would like you to review how this metric is calculated in your organisation?
Popular Practices Of Measuring Product Demand
The practices we observe in comparing demand performance products are,
1. Net Sales Value
2. Net Sales Quantity
3. Rate of Sale/week Value (Aggregate level)
4. Rate of sale/week Qty ( Aggregate level)
5. Rate of Sale/week Value (Style-Store level)
6. Rate of sale/week Qty ( Style-Store level)
7. Rate of sale/week Value (first “n” days-Aggregate level)
8. Rate of sale/week Qty (first “n” days-Aggregate level)
9. Rate of sale/week Value (first “n” days-Style-Store level)
10. Rate of sale/week Qty (first “n” days-Style-Store level)
Metrics 5,6,9,10 are relatively rare. Some brands use the first “n” days to reduce the complexity of figuring out when does the stock runs out. This is a smart way, but is that a good predictor of a product’s demand? In our observations, that depends on the nature of the product and the sales cycle. This method assumes that the first 4 weeks is a true representation of the season in terms of demand. Please see the patterns of sales we observed across time periods for different products in the trend graphs below (in spite of in-stock). Considering the different patterns, this method is also not robust.
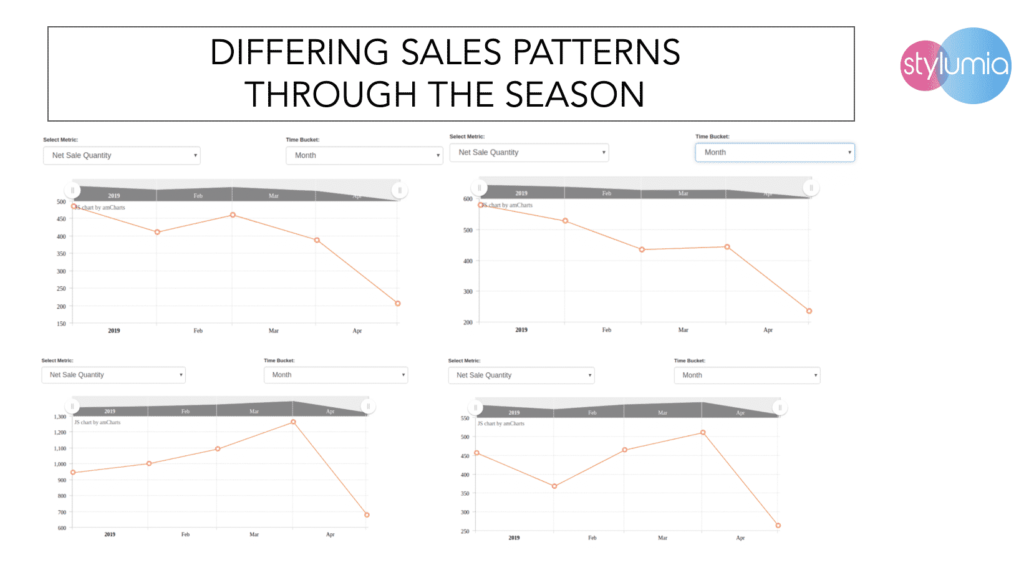
If the metrics we use are not reflecting the true demand, where are we heading in inventory optimization for fashion?
Accuracy Of Current Practices Vs True Demand
We recommend using daily stock data at style-store level and compute the ROS metric and aggregate at chain level considering stock availability. We compared various metrics to see the % error on product ranking for real consumer demand using the benchmark metric.
Here are the surprising results.
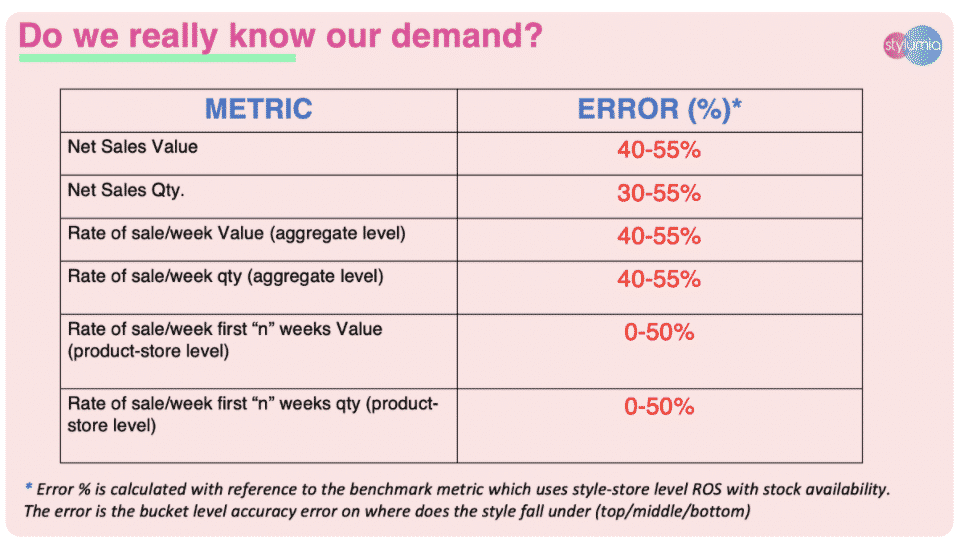
You can qualify the metric with level of discount / full price etc. to understand demand with qualifying criteria. A further sophistication is estimating demand with respect to the assortment available at a point in time. This needs sophisticated taste modelling.
These results are really shocking. What we many times think as the top seller are not the real top sellers, and that too with a high probability conditional on what metric we use.
This is dangerous as many decisions we do take seeing these results on re-order, replenishments, learning for future seasons etc.
Hence it is imperative for you to compute and review the right metrics rather than what is easy to compute. This also means it is essential to \ audit all the data collection process to ensure all relevant data is available for computing the right metrics.
At Stylumia, we are focused on understanding true demand through our proprietary Demand Science® engine. You can read more about our approach in our earlier article here.
In other words, right metric can be the difference in inventory optimization for the fashion business, and also to stay relevant and stay ahead.


